
Expand Menu
0
My cart
₹0.00

Shopping cart
CloseYour cart is empty, and it looks like you haven’t added anything yet.
-
Categories
-
 Python Programming
- Python Automation
- Python Mini Projects
- Python Desktop Applications
- Python GUI Applications
- Python Security Projects
- Python Productivity Applications
- GUI-Based Brand Logo Identification Game using Tkinter and Image Processing
- Python Game Development
- Financial Transaction Monitoring & Digital Payment System using Tkinter and SQLite3
-
 Java Development Projects
- Command-Line Applications
- Networking Applications
- File Management Applications
- Memory Puzzle Games
- Financial Learning Applications
- Utility Billing Systems
- Banking & Financial Management Systems
- Desktop Application Development
- Puzzle & Number Games
- GUI Applications
- Database Management Systems
- Web Applications
- REST API Development
- Fitness Management Systems
- Transport Management Systems
- Inventory Management Systems
- Food Inventory Management
- Hotel Management Systems
- Academic Management Systems
- Personal Finance Management
- Travel & Tourism Management Systems
- Retail & Billing Management Systems
- Payroll & Employee Management Systems
- Transportation & Booking Management Systems
- Media & Music Management Applications
- Internet & Browser Applications
- Puzzle & Logic Games
- Financial Utility Applications
- Card & Strategy Games
- Casual & Logic Games
- Adventure & RPG Games
- Education & School Management Systems
- Productivity & Text Editor Applications
- Utility & File Management Applications
- Banking & Financial Systems
- Contact & Information Management Systems
- Graphics & Drawing Applications
- Productivity & Task Management Applications
- Communication & Email Systems
- Web-Based Event Management Systems
- Online Examination & Quiz Systems
- Networking & Communication Applications
- Healthcare & Data Tracking Systems
- Web Development & Blogging Systems
- Web-Based Communication Systems
- Networking & Security Tools
- Cybersecurity & Cryptography
- GUI-Based Games
- Utility Tools
- Admin Management Systems
- Number Guessing Games
- Airline Management Systems
- Arcade & Classic Games
- Board & Strategy Games
- Food Ordering & Restaurant Management Systems
- Data Structures Visualization Tools
- File Management Systems
- Library & Education Management Systems
- HR & Employee Management Systems
-
 React JS Projects
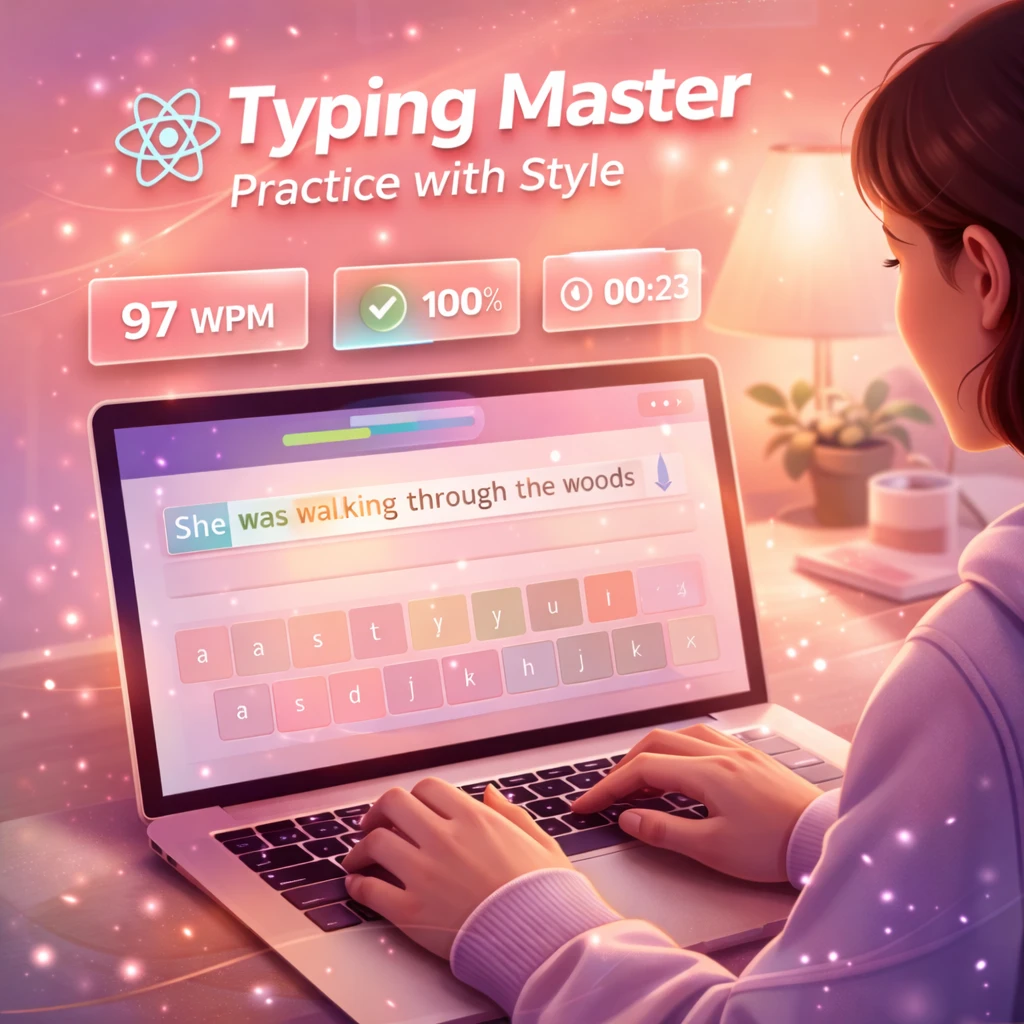
- Typing Tool
- Grid Game
- 3D Game
- Memory Game
- Travel Website
- Sound App
- Image Tool
- Card Game
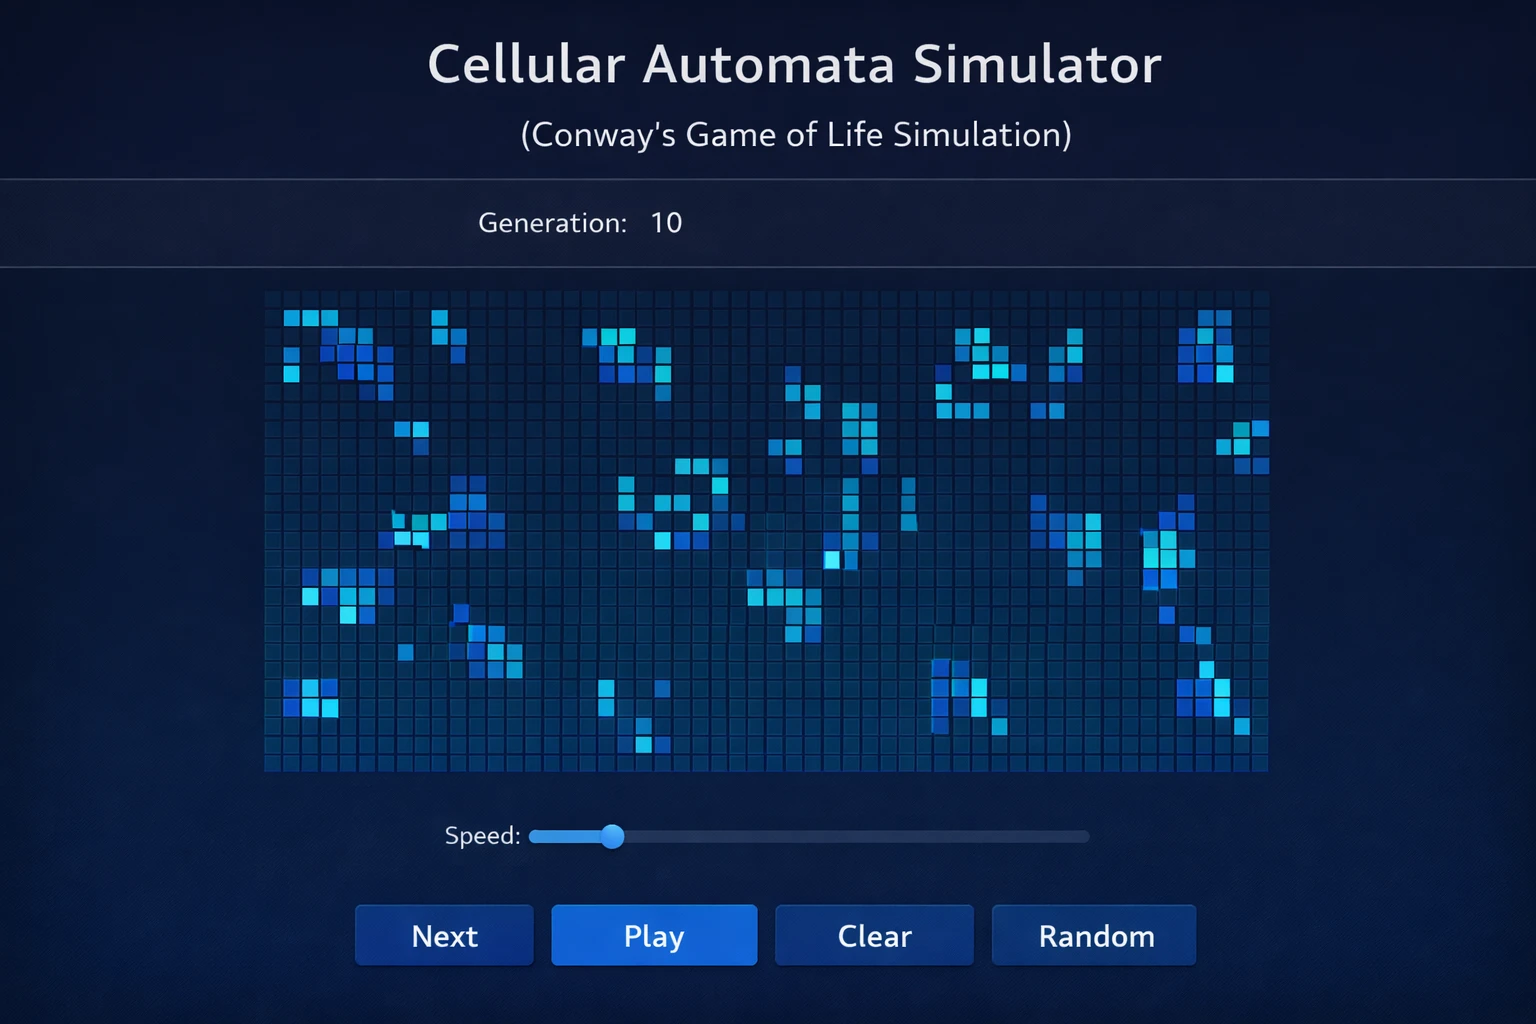
- Simulation
- Financial API App
- Physics Simulation
- Physics Simulation
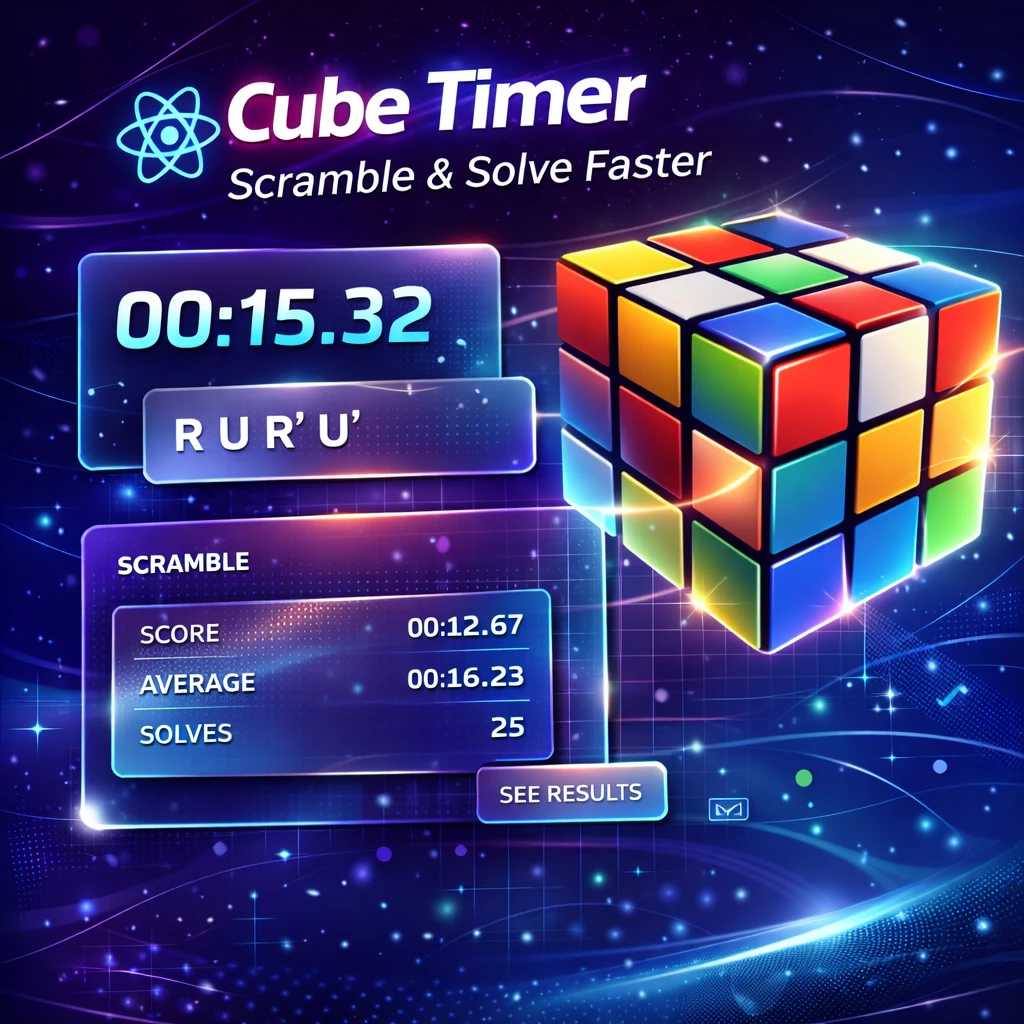
- Timer Tool
- Graphing Tool
- File Utility
- Sports Data App
- Crypto Tracker
- Anime Streaming UI
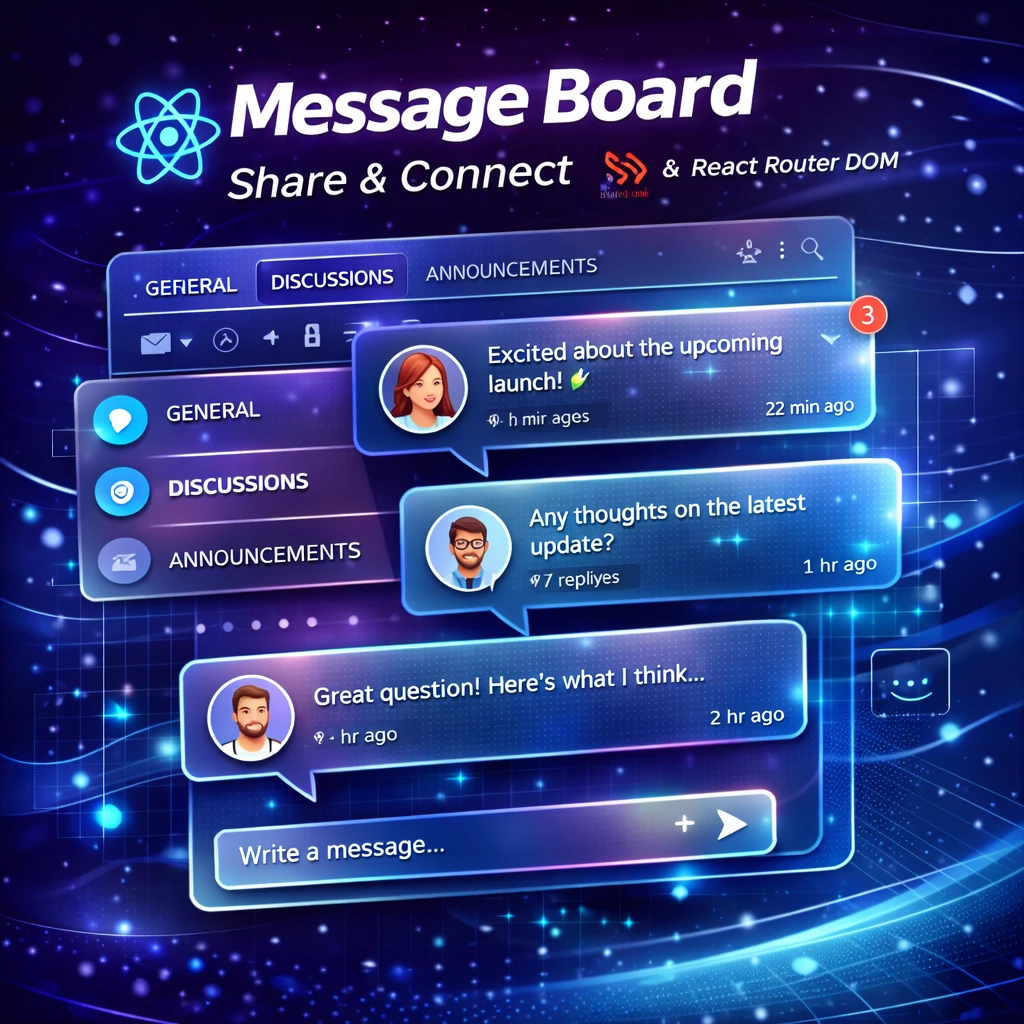
- Real-Time Chat App
- AI Text Processing
- Image Gallery
- 3D Customizer
- Business Website
- Rental Platform
- AI Text Tool
- Developer Tool
- Portfolio Website
- UI Component
- Arcade Game
- Image Editor
- Code Playground
- Entertainment App
- Reminder App
- Admin Dashboard
- Timeline UI
- Meal Planner
- Audio Streaming
- Character API App
- Superhero App
- E-Commerce App
- Real-Time Chat
- OTT App
- Video Platform
- Blogging App
- Social Media App
- Portfolio App
- Algorithm Visualizer
- Form Validation
- Logic Game
- Code Editor
- AI Vision App
- Sports Info App
- Sports API App
- Word Game
- Simulation Game
- Music Search App
- Book Search
- Map Based App
- Data Visualization
- Dice Game
- Casino Game
- Meme Generator
- News App
- Task Manager
-
 MERN Stack Projects
-
 Data Science & Analytics
-
 Web Development
-
 Cloud Computing & DevOps
-
 Internet of Things
-
 Computer Vision
- Intelligent Traffic Monitoring Systems
- AI Fitness & Human Activity Tracking
- Wildlife Surveillance & Conservation AI
- Driver Safety Intelligence Systems
- Driver Safety & Monitoring Systems
- AI Object Detection Systems
- Number Plate Detection and Recognition
- AI-Based Security Surveillance Systems
- Industrial Safety Monitoring Systems
- Smart Road Safety Systems
- Health Safety Monitoring Systems
- Human-Computer Interaction Systems
- AI-Based Attendance & Identity Systems
- Security & Threat Detection Systems
- Smart Surveillance & Crowd Monitoring Systems
- Human Behavior Analysis Systems
- Smart Driving Assistance Systems
- Human Attribute Recognition Systems
- Smart City Parking Solutions
- Smart Traffic Analysis Systems
- Industrial AI Monitoring Systems
-