
-20%

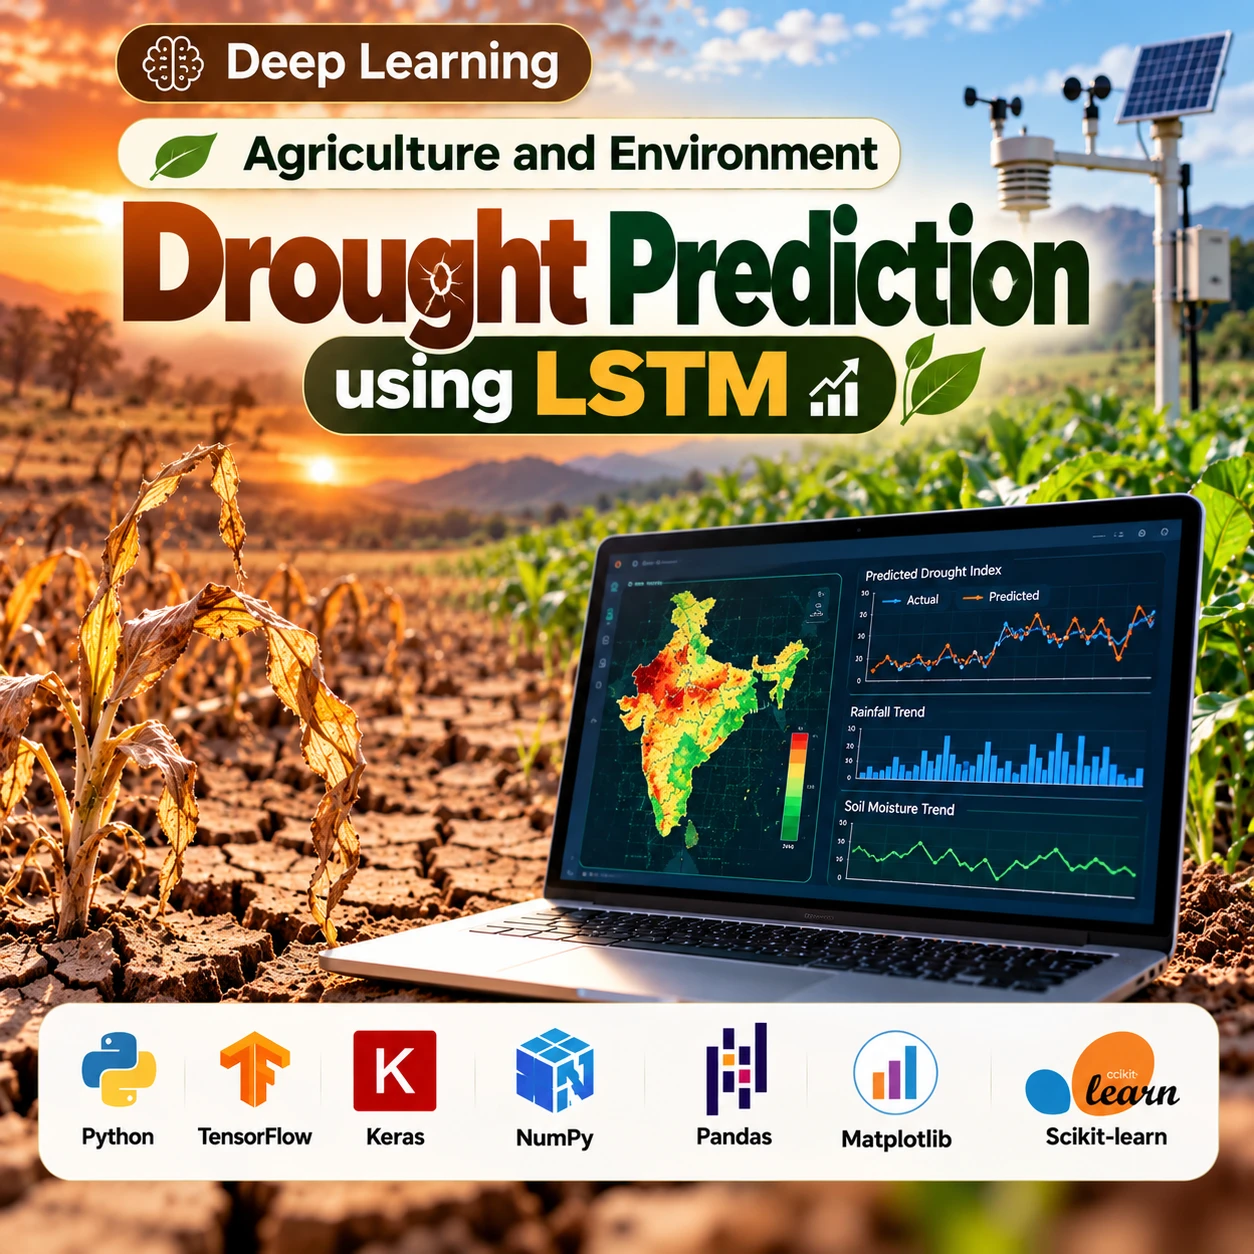
Drought Prediction using LSTM

0 Orders 0 Wish listed

₹4,999.00

Qty
Total price:
  ₹4,999.00

Detail Description

1. Abstract

Drought Prediction using LSTM is an artificial intelligence and deep learning project designed to predict potential drought conditions by analyzing historical weather, climate, and environmental data. Droughts can significantly affect agriculture, water availability, ecosystems, and local economies.

The system uses a Long Short-Term Memory (LSTM) neural network to learn temporal patterns from sequential data such as rainfall, temperature, humidity, soil moisture, evapotranspiration, and historical drought indicators. The trained model can forecast future drought conditions or drought-related indices, depending on the selected dataset and target variable.

2. Objectives

  1. Predict potential drought conditions using LSTM.
  2. Analyze historical climate and weather patterns.
  3. Forecast drought-related trends from time-series data.
  4. Analyze rainfall and temperature variations.
  5. Identify patterns associated with drought development.
  6. Support agricultural and water-resource planning.
  7. Provide early information about potential drought conditions.
  8. Apply deep learning to environmental prediction.
  9. Develop an easy-to-use drought prediction system.
  10. Support climate-resilient and smart-agriculture applications.

3. Existing System

Traditional drought monitoring and prediction commonly use:

  1. Historical rainfall analysis.
  2. Weather-station observations.
  3. Drought indices.
  4. Manual climate analysis.
  5. Statistical forecasting methods.
  6. Government and meteorological reports.
  7. Periodic environmental monitoring.

Limitations

  1. Traditional analysis can require significant manual effort.
  2. Complex temporal relationships may be difficult to capture.
  3. Changing climate patterns can affect historical assumptions.
  4. Large climate datasets are difficult to analyze manually.
  5. Short-term variations may not be captured effectively by simple averages.
  6. Conventional models may have limitations when dealing with complex nonlinear relationships.

4. Proposed System

The proposed system uses an LSTM-based deep learning model to learn temporal relationships in historical climate and environmental data.

Possible Input Features

  1. Rainfall
  2. Temperature
  3. Humidity
  4. Soil moisture
  5. Evapotranspiration
  6. Surface water availability
  7. Historical drought index
  8. Atmospheric conditions
  9. Seasonal information
  10. Previous climate observations

Workflow

Climate Data → Preprocessing → Time-Series Sequence Creation → LSTM Model → Drought Prediction → Visualization

Depending on the dataset, the project can be implemented as:

  1. Regression: Predict a drought index or continuous drought severity value.
  2. Classification: Predict categories such as Normal, Mild, Moderate, Severe, or Extreme Drought.

The exact categories should match the selected dataset and target variable.

5. Implementation Procedure

Step 1: Dataset Collection

Collect historical climate and environmental time-series data containing drought-related variables.

Suitable datasets may contain:

  1. Rainfall records
  2. Temperature measurements
  3. Humidity
  4. Soil moisture
  5. Drought indices
  6. Historical drought labels
  7. Geographic or seasonal information

Step 2: Data Preprocessing

  1. Handle missing values.
  2. Remove duplicate records.
  3. Sort observations chronologically.
  4. Handle outliers appropriately.
  5. Encode categorical variables if required.
  6. Normalize numerical features.
  7. Align observations according to their time intervals.

Step 3: Exploratory Data Analysis

Analyze:

  1. Rainfall trends.
  2. Temperature variations.
  3. Historical drought patterns.
  4. Seasonal changes.
  5. Soil-moisture trends.
  6. Relationships between climate variables and drought conditions.

Visualizations can include time-series plots, correlation matrices, heatmaps, and drought-severity charts.

Step 4: Feature Engineering

Create meaningful temporal features such as:

  1. Previous rainfall values.
  2. Moving rainfall averages.
  3. Temperature trends.
  4. Previous drought index values.
  5. Seasonal indicators.
  6. Soil-moisture changes.
  7. Rolling climate statistics.

Step 5: Sequence Creation

Convert historical observations into sequential input windows suitable for LSTM.

For example:

Previous Climate Observations → LSTM → Future Drought Condition

The sequence length should be selected based on the forecasting period and available data.

Step 6: LSTM Model Development

A typical architecture may include:

  1. Input Layer
  2. LSTM Layer
  3. Dropout Layer
  4. Additional LSTM/Dense Layer
  5. Output Layer

For regression, the output can predict a continuous drought index. For classification, the final layer can produce the selected drought categories.

Step 7: Model Training

Split the time-series dataset chronologically into training, validation, and testing sets to avoid future information leaking into training.

Train the LSTM using an optimizer such as Adam and an appropriate loss function.

Step 8: Model Evaluation

For regression, evaluate using:

  1. MAE
  2. MSE
  3. RMSE
  4. R² Score
  5. MAPE, when appropriate

For classification, evaluate using:

  1. Accuracy
  2. Precision
  3. Recall
  4. F1-Score
  5. Confusion Matrix
  6. ROC-AUC, where appropriate

Step 9: Drought Prediction

The user provides the required recent climate observations, and the trained LSTM model predicts the future drought condition or drought index.

Step 10: Application Development

Develop a Streamlit or Flask-based dashboard containing:

  1. Location/region selection
  2. Climate-data input
  3. Drought prediction
  4. Drought severity
  5. Historical climate trends
  6. Prediction charts
  7. Actual vs predicted values
  8. Model performance information
  9. Prediction history

6. Software Requirements

  1. Operating System: Windows / Linux
  2. Programming Language: Python
  3. IDE: VS Code / Jupyter Notebook / Google Colab
  4. Deep Learning: TensorFlow/Keras or PyTorch
  5. Libraries: NumPy, Pandas, Scikit-learn
  6. Visualization: Matplotlib / Seaborn / Plotly
  7. Web Framework: Streamlit / Flask
  8. Model: LSTM
  9. Dataset: Historical Climate and Drought Dataset
  10. Browser: Google Chrome / Microsoft Edge

7. Hardware Requirements

  1. Processor: Intel Core i5 or equivalent
  2. RAM: Minimum 8 GB
  3. Storage: Minimum 20 GB free space
  4. Display: 1366 × 768 or higher
  5. GPU: Recommended for faster deep-learning training, but not mandatory for smaller datasets
  6. Keyboard and Mouse: Standard
  7. Internet: Required for dataset and software installation

8. Advantages of the Project

  1. Uses LSTM for drought time-series prediction.
  2. Learns temporal relationships from historical climate data.
  3. Can incorporate multiple weather and environmental variables.
  4. Supports early drought-risk assessment.
  5. Helps agricultural planning.
  6. Supports water-resource management.
  7. Provides visual drought trends and forecasts.
  8. Can be extended to different regions.
  9. Supports climate-resilient agriculture.
  10. Can be integrated into environmental monitoring systems.
  11. Provides a foundation for AI-based drought early-warning systems.


No review given yet!

Fast Delivery all across the country
Safe Payment
7 Days Return Policy
100% Authentic Products

You may also like

View all

Synthetic Medical Image Generation using Diffusion Models

₹4,999.00

Self-Supervised Learning for Medical Images with Limited Labels

₹4,999.00

Multimodal Disease Diagnosis using Images and Clinical Records

₹4,999.00

U-Net-Based Brain-Tumour Segmentation

₹4,999.00

Diabetic Retinopathy Severity Classification

₹4,999.00

Drought Prediction using LSTM
₹4,999.00 ₹0.00
₹4,999.00
4999